TM5-6675-326-14
8-6.12.5 Linear Regression - Continued
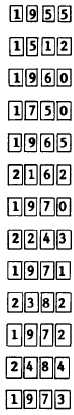
3.0000
1,512.0000
4.0000
1,750.0000
5.0000
2,162.0000
6.0000
2,243.0000
7.0000
2,382.0000
8.0000
2,484.0000
9.0000
All data pairs have been keyed in.
L.R.
-118,290.6294
T h e y - i n t e r c e p t o f t h e l i n e.
xY
61.1612
Slope of the line.
8 - 6 . 1 2 . 6 L i n e a r E s t i m a t i o n.
With data accumulated in registers R.0
t h r o u g h R .5 , a predicted value for y (denoted y) can be calculated by
keying in a new value for x and pressing q y. A predicted value for x
(denoted x) can be calculated by keying in a new value for y and pressing
~x
Example:
With data intact from previous example in registers
R .0 t h r o u g h R.5 , to predict demand for motor fuel for
the years 1980 and 2000, key in new x values and press
HY*
To determine the year that the demand for
motor fuel is expected to pass 3,500 million
barrels,
k e y i n 3 , 5 0 0 ( n e w v a l u e f o r y ) a n d p r e s s qx
Keystrokes
D i s p l ay
lm!lmm19 2 , 8 0 8 . 6 2 6 4
Predicted demand in millions
of barrels for the year 1980.
8-25