TM5-6675-326-14
8-6.12.5 Linear Regression
b .
When q L.R.
- Continued
i s p r e s s e d:
(1)
The
contents
of
the
stack
registers
are
lifted
just
as
t h e y a r e w h e n y o u p r e s s RCL ~+.
(2) The slope (A) of the least squares line of the data is
a v a i l a b l e i n t h e Y - r e g i s t e r o f t h e s t a c k.
( 3 ) T h e y - i n t e r c e p t ( B ) o f t h e l e a s t s q u a r e s l i n e o f t he
data appears in the displayed X-register of the stack.
c . T o u s e v a l u e f o r A o r t o b r i n g i t i n t o d i s p l a y e d X - r e g i s t e r ,
s i m p l y s h i f t s t a c k c o n t e n t s w i t h t h e x~y k e y.
Example: An oil company wishes to know the slope and
y-intercept of a least squares line for the consump-
tion of motor fuel in the United States against time
since 1945.
It knows the data given in the table.
Motor Fuel
Demand
( M i l l i o n s o f
B a r r e l s)
696
994
1330
1512
1750
2162
2243
2382
2484
Year
1945
1950
1955
1960
1965
1970
1971
1972
1973
S o l u t i o n:
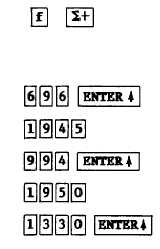
Key the data into the calculator using the~key,
then press q L.R a n d p r e ss
Keystrokes
Display
0.0000
6
9
6 .
0
0
0
0
1.0000
994.0000
C l e a r s t a t i s t i c a l s t o r a ge
r e g i s t e r s . ( D i s p l a y s h o wn
assumes no results remain
from previous calculations.)
2.0000
1,330.0000
8-24