
TM 5-6675-324-14
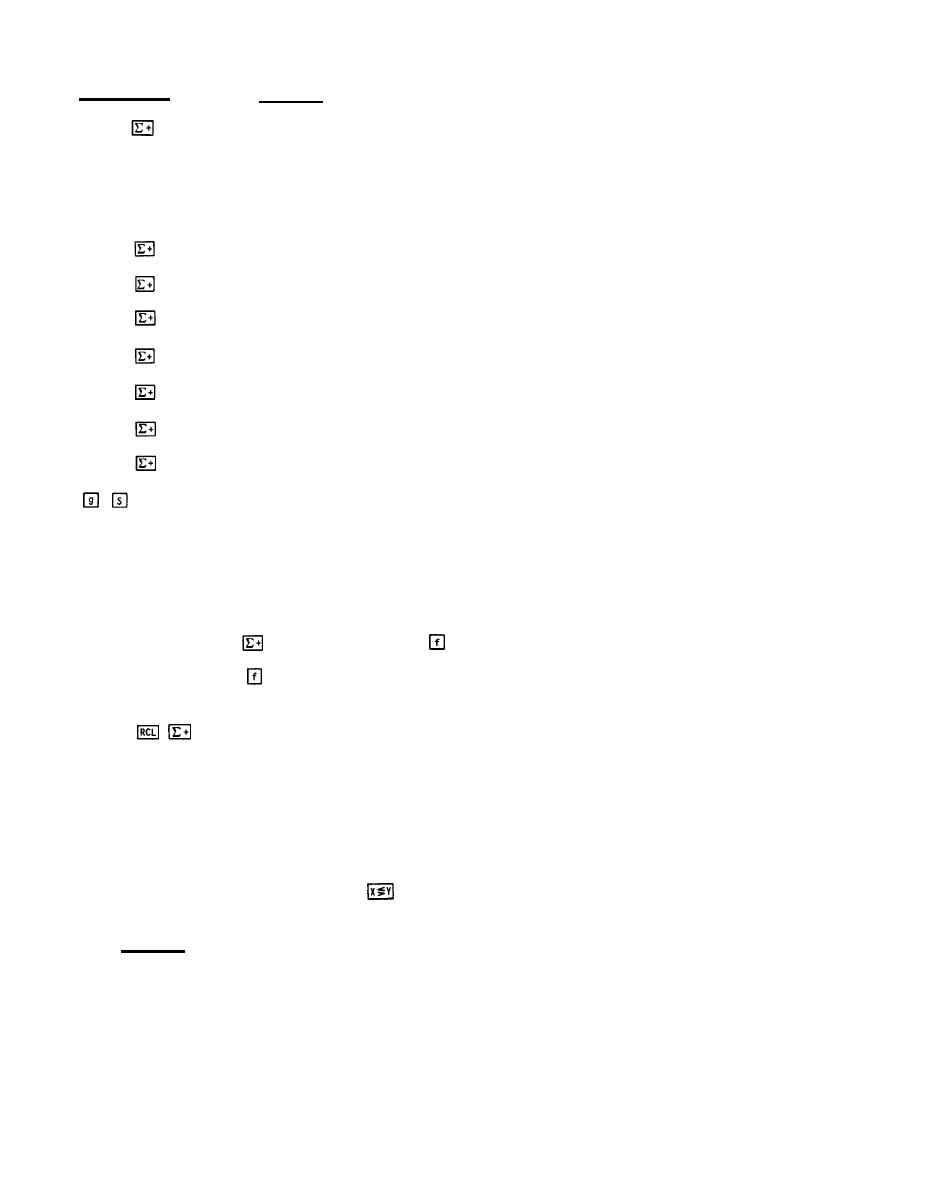
Keystrokes
Display
First score is entered.
1.0000
79
Since this problem involves
only one variable, y-value
does not have to be entered
into Y-register using the
key.
m
94
Display shows number of scores
2.0000
entered so far.
68
3.0000
86
4.0000
82
5.0000
78
6.0000
83
7.0000
89
Last score in sample.
8.0000
Standard deviation of test
7.8365
scores.
(5) Linear regression. Linear regression is a statistical method for finding
a straight line that best fits a set of data points, thus providing a relationship
between two variables.
(a) To use the linear regression function, first key in a series of data
points using the
key. Then press
L.R.
L.R. if pressed:
(b) When
The contents of the stack registers are lifted just as they are when you
press
.
The slope (A) of the least squares line of the data is available in the
Y-register of the stack.
The y-intercept (B) of the least squares line of the data appears in the
displayed X-register of the stack.
(c) To use value for A or to bring it into displayed X-register, simply
shift stack contents with the
key.
Example: An oil company wishes to know the slope and y-intercept of a least
squares line for the consumption of motor fuel in the United States against time
since 1945. It knows the data given in the table.
7-32
