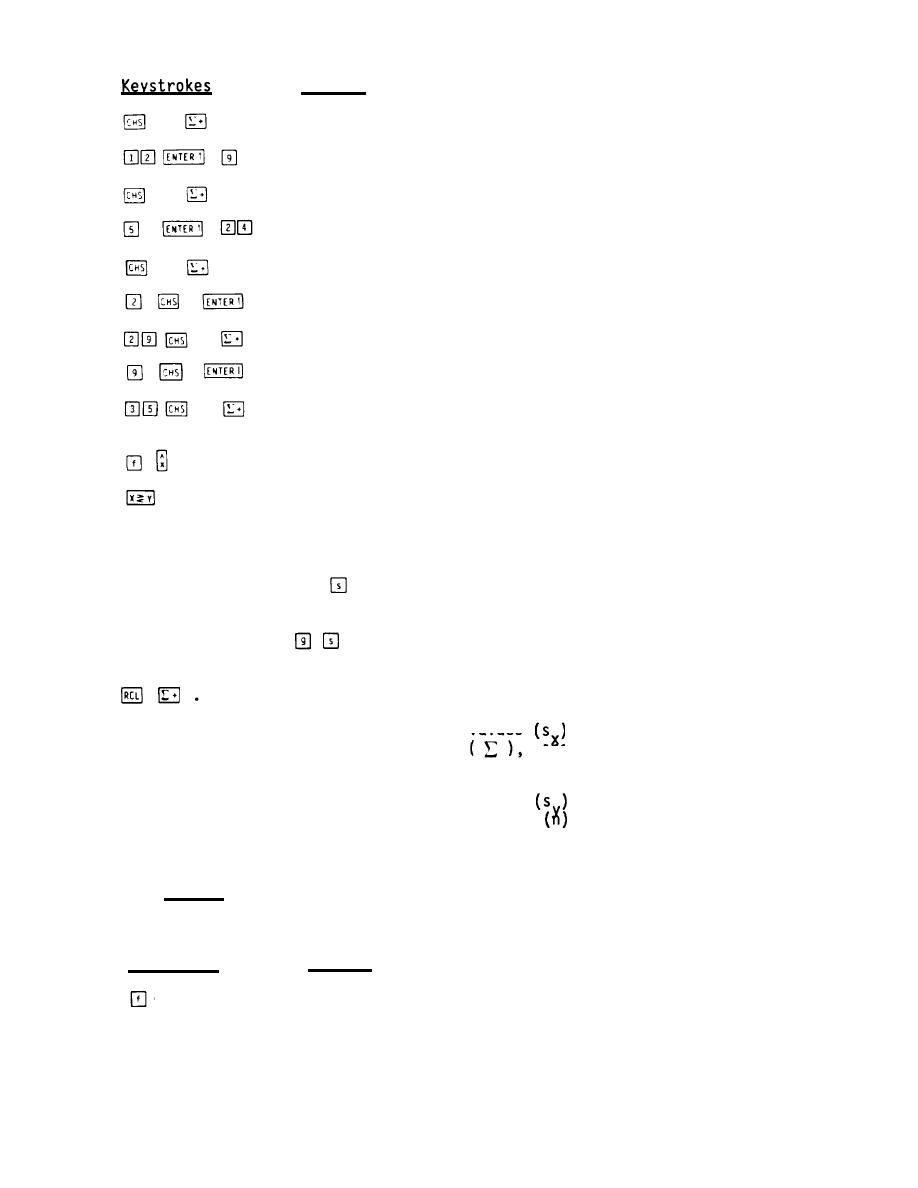
TM 5-6675-323-14
Display
3.0000
9.
4.0000
24.
5.0000
-2.0000
6.0000
-9.0000
N u m b e r of data pairs (n) is
7.0000
now 7.
Average low temperature.
-21.5714
Average high temperature.
5.2857
(4)
Standard
deviation.
(a) Pressing
computes the standard deviation (a measure of dispersion
a r o u n d the mean) of accumulated data.
(b)
When
is
pressed:
The contents of stack registers are lifted just as they are when pressing
The standard deviation of x values
) is calculated using data
and R.0 (n). T h e result appears in
accumulated in registers R.2 (2), R.1
displayed X-register.
The standard deviation of y values
is calculated using data accumu-
The result appears in Y--
R.3 (y), and R.o
lated
in
registers
R.4
(y2),
register.
To determine the standard deviation of the following test scores:
Example:
7 9 , 94, 68, 86, 82, 78, 83, and 89, press
Display
Keystrokes
Clear statistical registers
CLEAR ALL
0.0000
a n d Y - r e g i s t e r f o r n e wj
one-variable problem.
13-31

